 NGDC for Kenya
1000000
Type of resources
Topics
Keywords
Contact for the resource
Provided by
Formats
Update frequencies
status
Scale
-
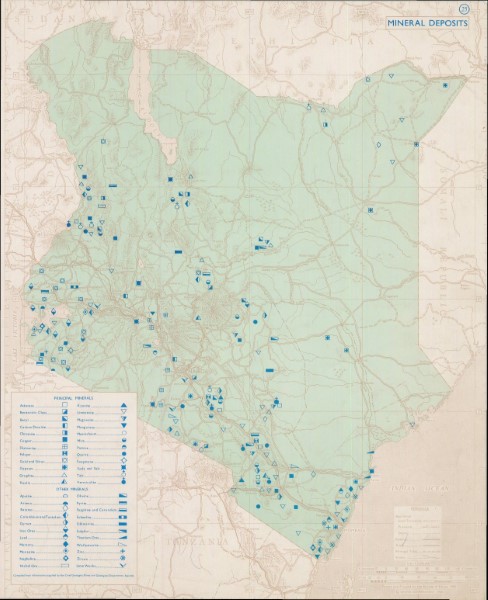
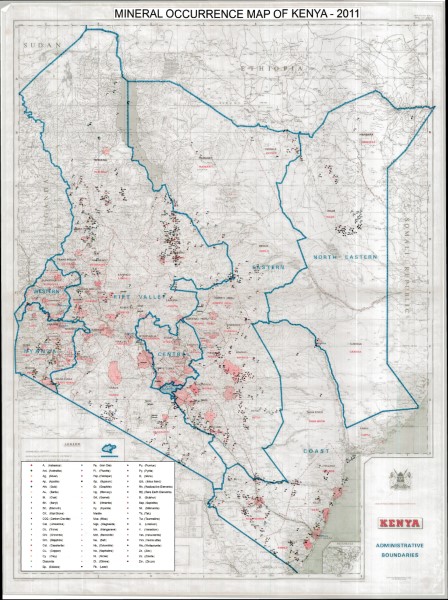
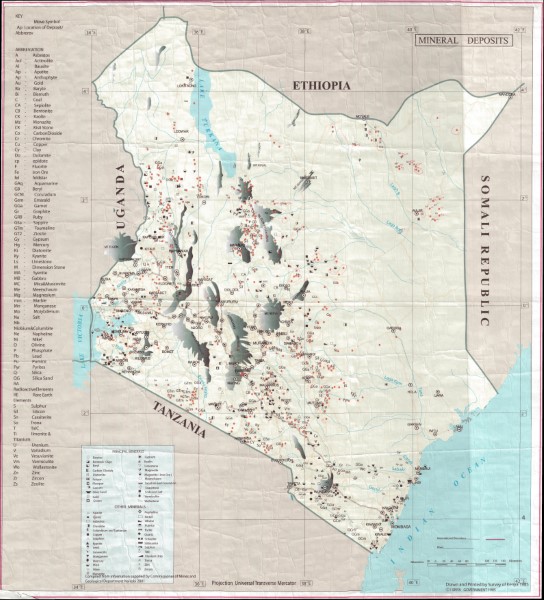
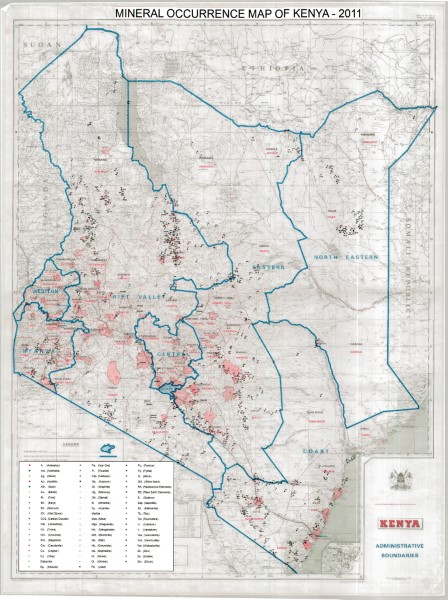
Originally called the Mineral Deposits map (1969) and revised in 2001, this map was re-released as the Mineral Occurrence Map of Kenya in 2011. The base map is the Administrative boundaries map SK81A at 1:1 million scale overlaid with the location recorded location of mineral occurrences.
-
Originally called the Mineral Deposits map (1969) and revised in 2001, this map was re-released as the Mineral Occurrence Map of Kenya in 2011. The base map is the Administrative boundaries map SK81A at 1:1 million scale overlaid with the location recorded location of mineral occurrences.
-
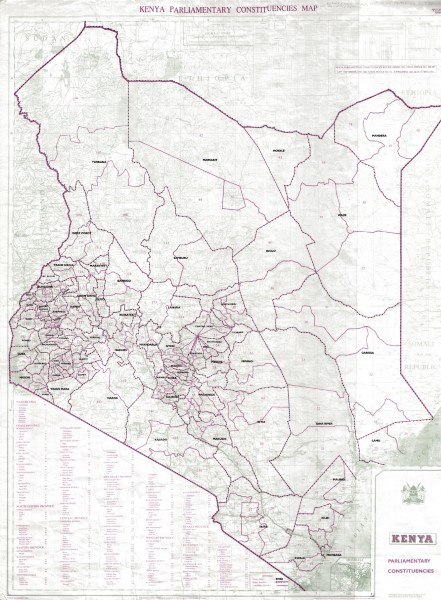
Kenya Parlimentary Constituencies
-
Originally called the Mineral Deposits map (1969) and revised in 2001, this map was re-released as the Mineral Occurrence Map of Kenya in 2011. The base map is the Administrative boundaries map SK81A at 1:1 million scale overlaid with the location recorded location of mineral occurrences.
-
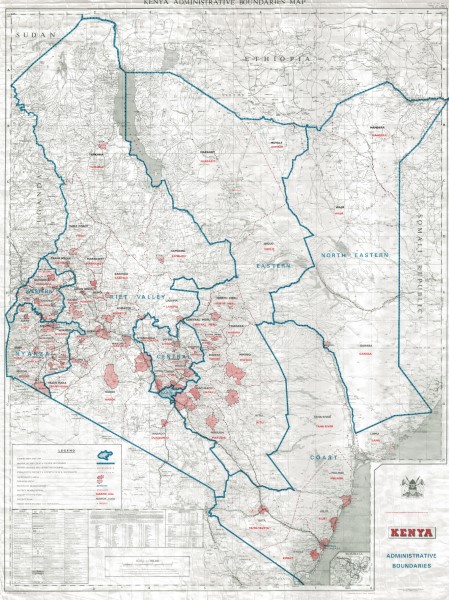
Administrative Boundaries
-
Originally called the Mineral Deposits map (1969) and revised in 2001, this map was re-released as the Mineral Occurrence Map of Kenya in 2011. The base map is the Administrative boundaries map SK81A at 1:1 million scale overlaid with the location recorded location of mineral occurrences.
-
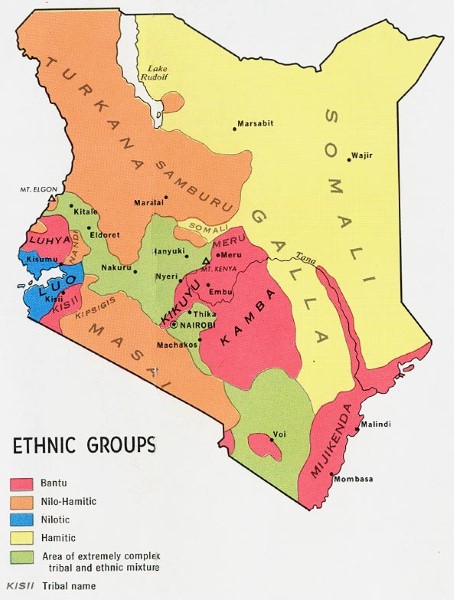
Ethnic group map illustrates the extent and distribution of the different ethnic groups within Kenya. Major towns are indicated on the map but no further topographic detail is included.
-
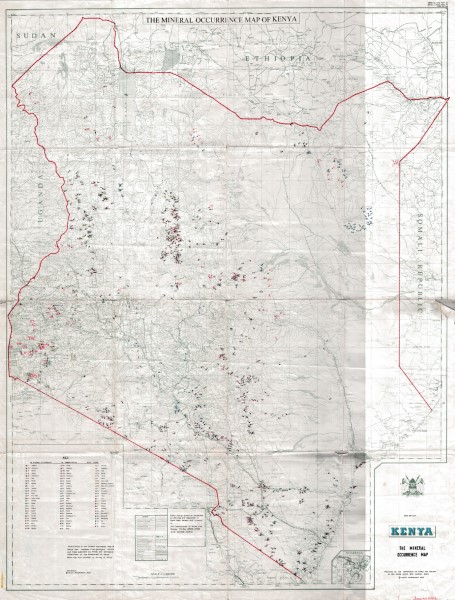
Originally called the Mineral Deposits map (1969) and revised in 2001, this map was re-released as the Mineral Occurrence Map of Kenya in 2011. The base map is the Administrative boundaries map SK81A at 1:1 million scale overlaid with the location recorded location of mineral occurrences.
-

Originally called the Mineral Deposits map (1969) and revised in 2001, this map was re-released as the Mineral Occurrence Map of Kenya in 2011. The base map is the Administrative boundaries map SK81A at 1:1 million scale overlaid with the location recorded location of mineral occurrences.
-

Based on the 1: 1 million geological map this interpretation shows groundwater potential classed as High, Good, Low, Poor. No information is available as to the origin of this interpreation or the source data upon which it is based.